It is easy to think of climate change as something that will affect us in the distant future.
It is easy to think of global warming as something that is relevant only to other people who live in low-lying coastal areas – or if you are a polar bear.

Polar bear on an ice floe, a distant depiction of climate change that is hard to relate to. Photo: Ansgar Walk. Source: Wikimedia Commons.
The reality is, climate change can be seen anywhere and everywhere.
Climate change impacts, causes and solutions are all present or represented in the landscapes we inhabit. We live in the shadow of the high-carbon lifestyle to which humanity, at least in western countries, has grown accustomed.

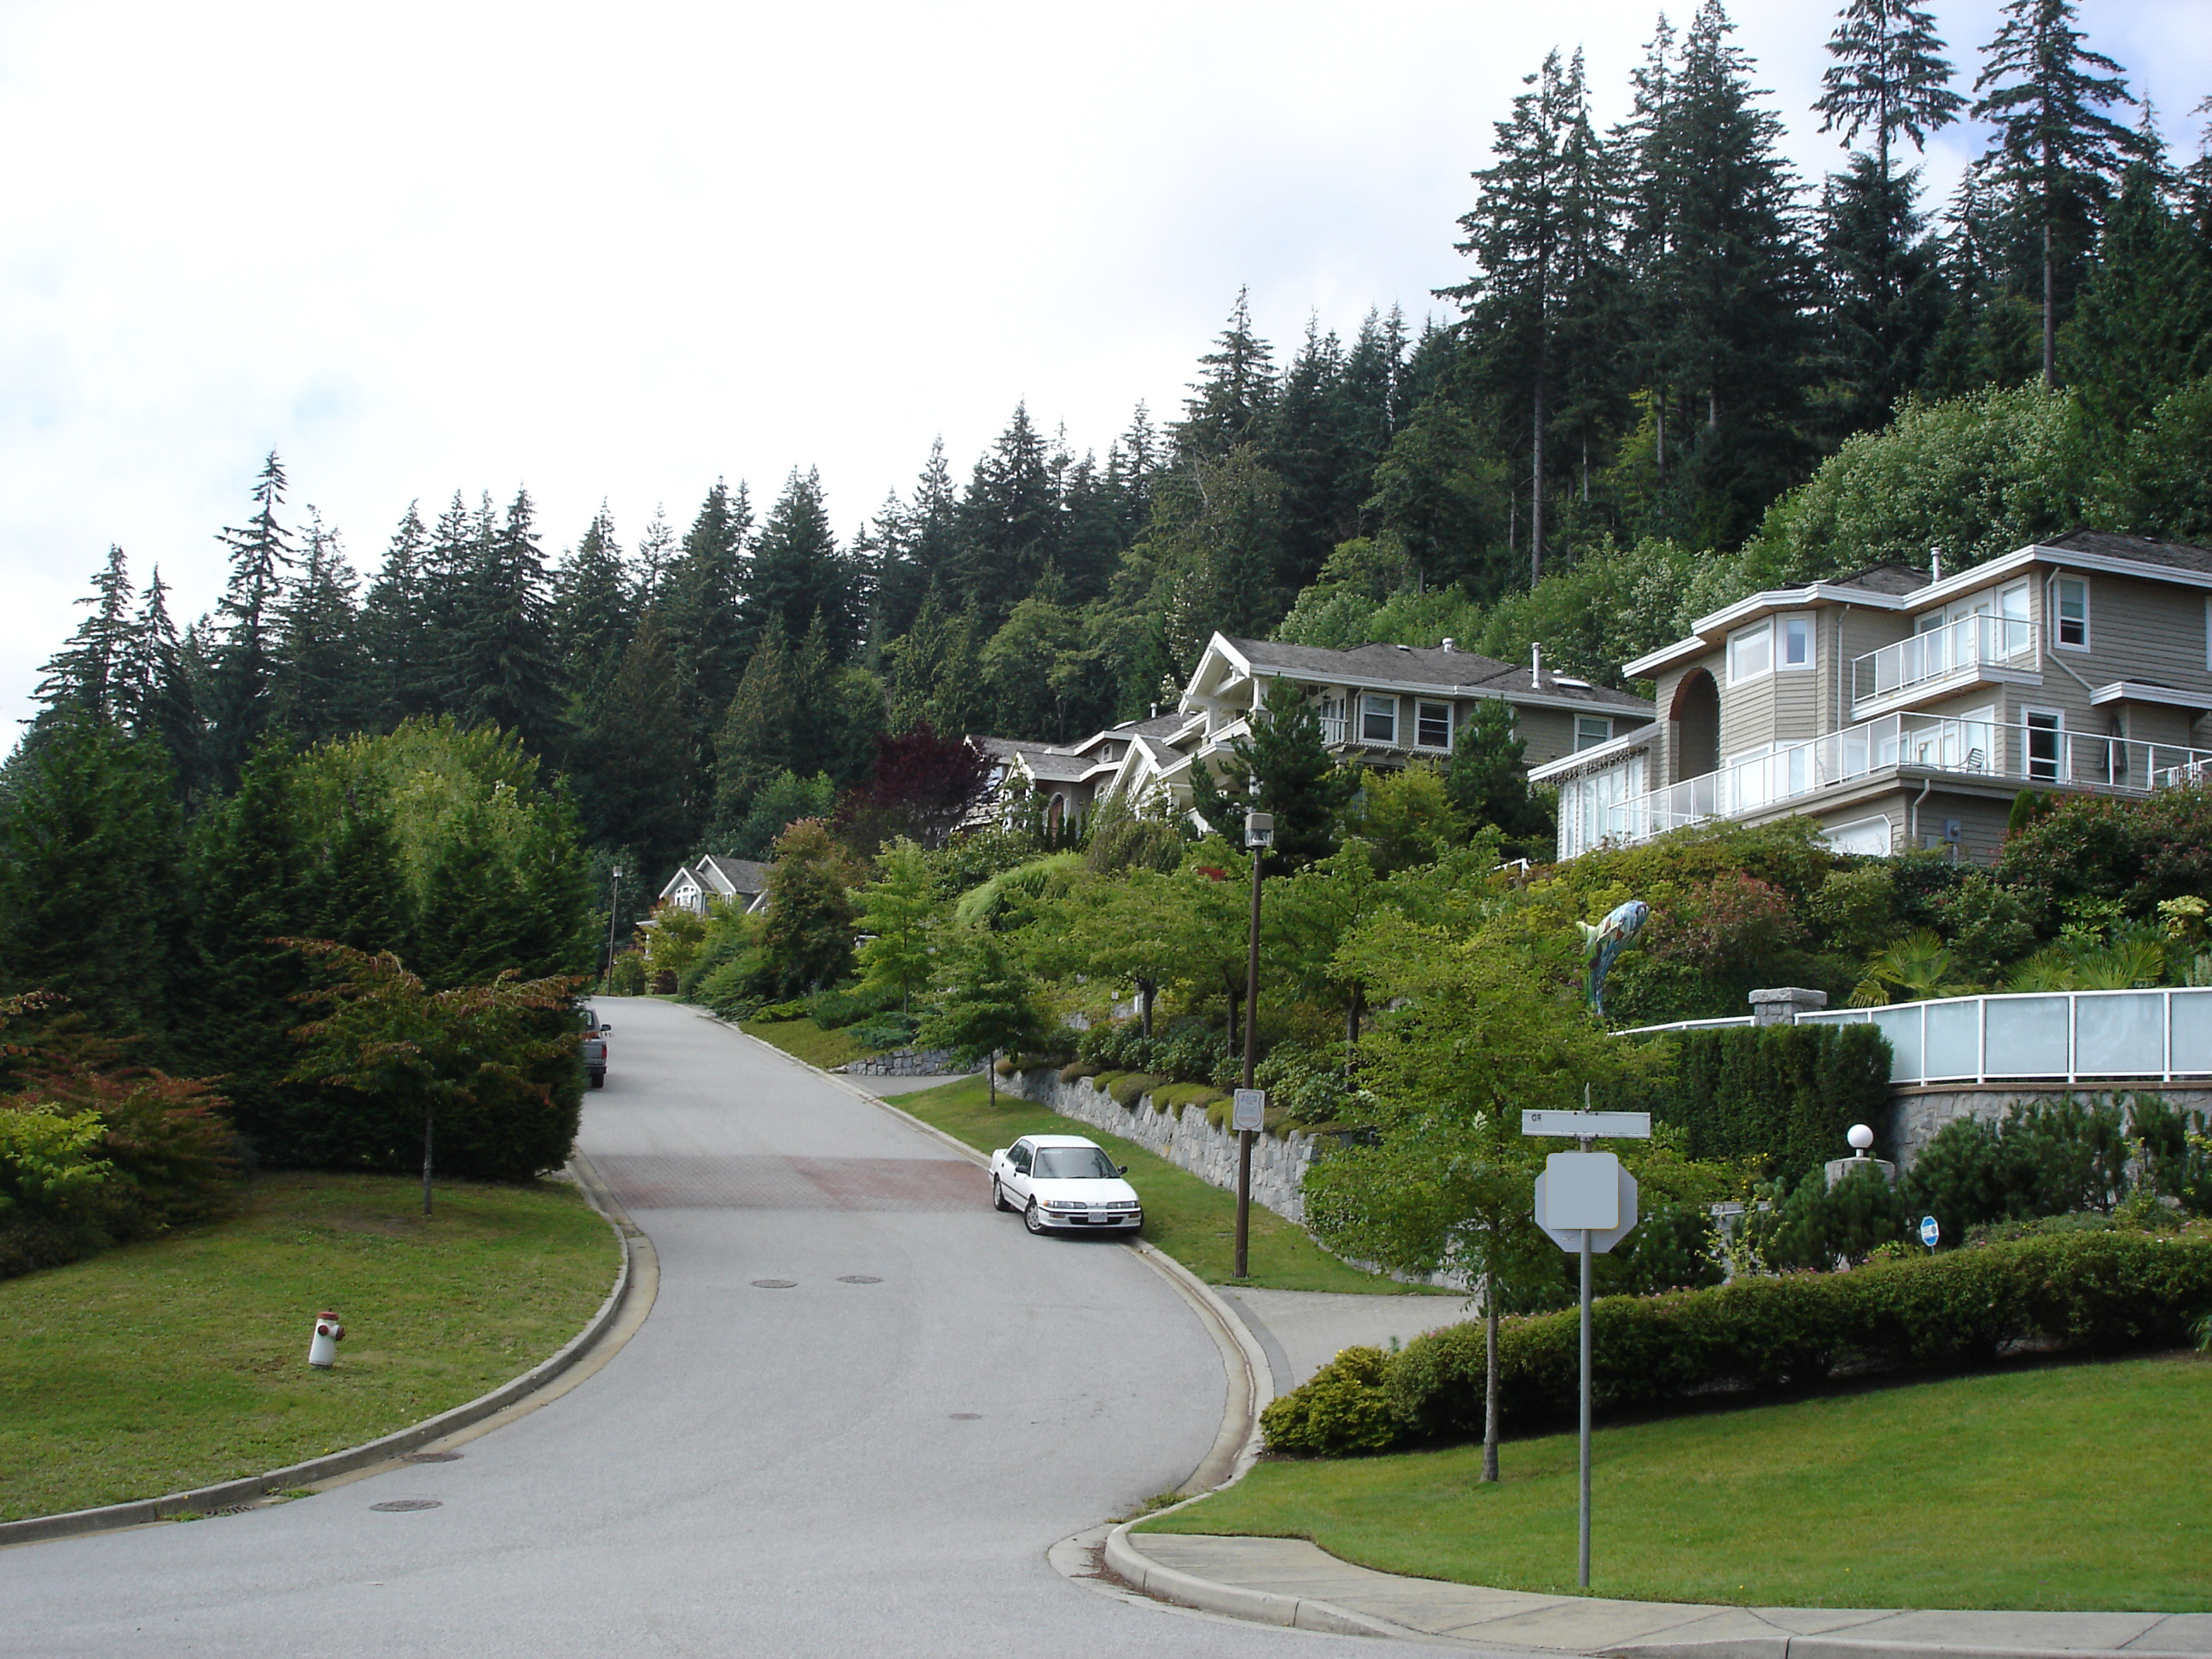
High carbon suburban landscape. Can you see where carbon emissions come from? Photo: S. Sheppard
By learning to see these signifiers of climate change, we can overcome the disconnect between our thinking and the reality. We can begin to understand the wider impact of climate change on our daily lives, which may encourage us to switch to more sustainable, lower-carbon lifestyles and resilient neighbourhoods.
The goal of this series of blog posts: to encourage thoughtful and collective climate action at the neighbourhood scale, through a change in the way we see and perceive the landscape we inhabit, using a climate change lens.
This series will provide a sample of the many ways we can make climate change visible in our own backyards, as a way to stimulate discussions among neighbours and foster local action. Examples will be drawn from the book Visualizing Climate Change and from success stories in real communities. We will also help you to to start thinking about and visualizing your own future, ranging from simple do-it-yourself visual techniques to the latest smart visioning tools.
Can you see opportunities for a more sustainable, more energy efficient, lower-carbon community to develop? Photo: S. Sheppard

These are only some of the ways in which this neighbourhood could be adapted to become more sustainable. Visualization: J. Laurenz, CALP, UBC
Over time the blog will provide a tool-kit with new concepts, little-known key facts, and practical tips for positive action, accompanied by eye-catching visuals to grab people’s attention and prove our point: climate change can be seen and solved in our own backyards.
We welcome you to share your ideas or community success stories by tweeting us @VisualizingCC
To read the latest posts, make sure to sign-up for our RSS feed!
Stephen Sheppard and Mayara Benedetti
All visual and written content originally published in Visualizing Climate Change.